Hi there! How do you make sure you are optimizing the effectiveness of your digital marketing strategy? Web analytics is to the rescue. It’s about knowing what your audience is doing on your website, finding out what works and augmenting what doesn’t. In this module, we’ll explain the basics of web analytics and how you can use it to get your marketing strategy off the ground.
- At the end of this module you should know:
- What is web analytics and why does it matter?
- How to use tools such as Google Analytics, and how to set them up.
- Metrices to monitor for business success
- Guiding principles for data interpretation.
Let’s get started! 📊
Table of Contents
What is Web Analytics?
Web analytics is the collection, measurement, and analysis of website data. This knowledge enables companies to comprehend user activity and to have the right information so as to find the best choices for the advancement of their online appearance.
Why Web Analytics Matters
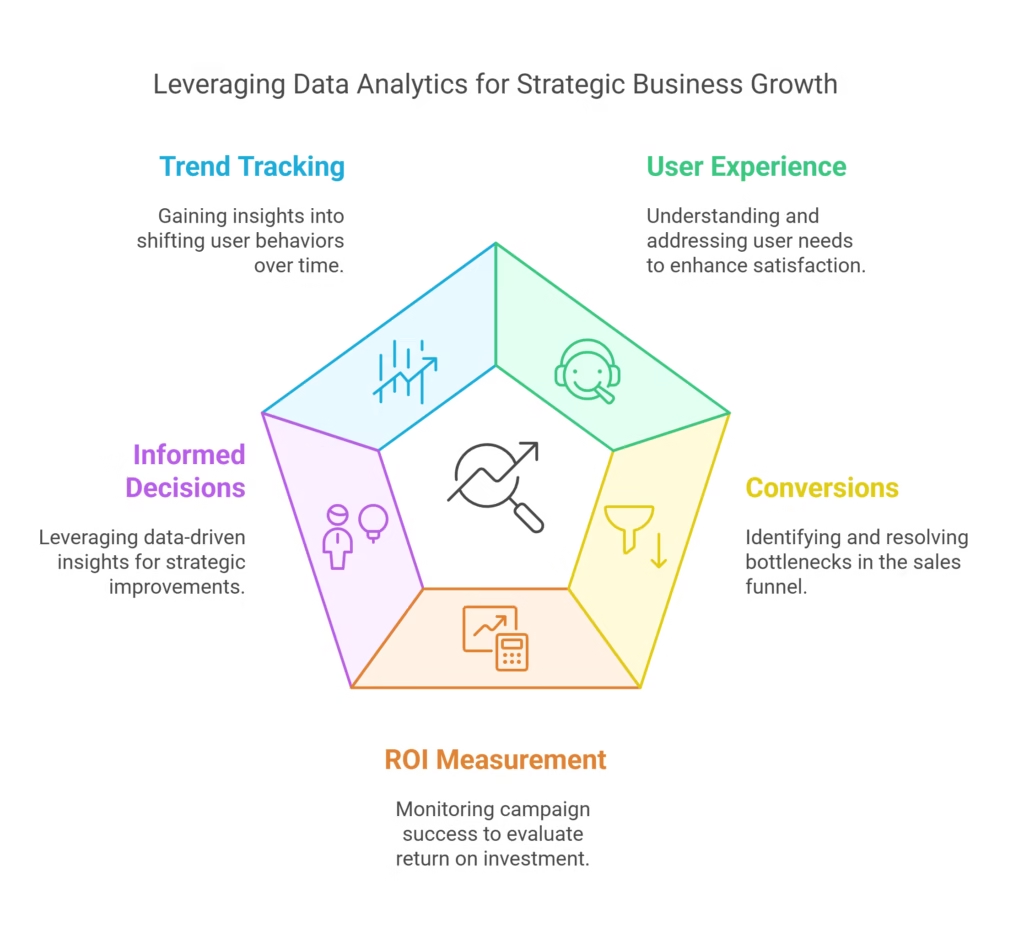
- Enhances User Experience: Know the needs of the users and take action.
- Increases Conversions: This is where you trace bottlenecks in your sales funnel.
- Measuring ROI: Monitor the success of your campaigns.
- Informs decisions — Data-driven insights lead to better strategies
- Tracking Trends: Gain insight into shifting user behavior.

How to get started with Web Analytics
Step 1: Set Your Goals
Before diving into analytics, define what you want to achieve. Common goals include:
- Increasing website traffic
- Improving conversion rates
- Reducing bounce rates
- Enhancing customer engagement
Step 2: Choose Your Tools
There are some well-known web analytics tools developers use; these are:
- Google Analytics: De Facto Standard For Website Tracking
- Adobe Analytics: Advanced tracking and segmentation features.
- Matomo: A feature-rich open-source alternative.
- Microsoft Clarity: User-behavior-oriented with heatmaps and session recordings.
Step 3: Get analytics software
Once you’ve picked the tool, get it integrated with your website:
- Sign up for an account with your analytics provider.
- Include the tracking code in the header of your website or with a plugin.
- Check the installation and ready to collect data.
Understanding Key Metrics of Web Amalytics
Web analytics offers a wealth of data, but not all metrics are equally important. Focus on these key performance indicators (KPIs):
1. Traffic Metrics
| Metric | What It Tells You |
|---|---|
| Sessions | Total visits to your site |
| Users | Unique visitors to your site |
| Pageviews | Total pages viewed by users |
| Traffic Sources | Where visitors are coming from (organic, social, etc.) |
2. Engagement Metrics
| Metric | What It Tells You |
| Bounce Rate | Percentage of visitors who leave without interacting |
| Average Session Duration | Time spent on your site per visit |
| Pages Per Session | Average number of pages viewed in a session |
3. Conversion Metrics
| Metric | What It Tells You |
| Goal Completions | Number of specific actions completed (e.g., sign-ups) |
| Conversion Rate | Percentage of visitors who complete a desired action |
| Cart Abandonment Rate | Percentage of users who don’t complete purchases |
How to Analyze Your Web Analytics Data
Data is only useful if you know how to interpret it. Here’s a simple process to analyze your web analytics data:
Identify Trends
Identify the trends in your data. Are some pages receiving more traffic? Is one source of traffic converting better than the other?
Compare Periods
Examine the data for various time horizons for a sense of progression or regression. For example:
- Evaluate how this month looked as compared to last month.
- Analyze year-over-year seasonality.
Segment Your Audience
Break down your data by:
- Demographics: Age, sex, location
- Type of Device: Mobile, Desktop, tablet
- Behavior: New vs returning visitors
Identify Bottlenecks
Funnel analysis shows you where users drop off. For example:
- Users are abandoning carts during checkout?
- Forms can be too long or complex?
Tools and Techniques for Advanced Analytics
1. Heatmaps
Tools like Hotjar and Crazy Egg provide heatmaps that show where users click, scroll, and hover on your site.
2. A/B Testing
Compare two versions of a page or element to see which performs better. For example:
- Test different headlines or CTAs.
- Analyze changes in conversion rates.
3. Funnel Visualization
Tools like Google Analytics offer funnel analysis to understand user journeys. Identify steps where users drop off and optimize them.
4. Event Tracking
Track specific actions like button clicks, video plays, or downloads. Set up event tracking in tools like Google Analytics for detailed insights.
Web Analytics Mistakes You Should Never Make
- Lack of Goals: What’s your goal, and what’s the aim of your data?
- Vanity Metrics: Make your goals tangible, not just a bunch of numbers.
- Disregarding Mobile Data: Mobile consumers don’t always act like desktop consumers.
- Not Segmenting Data: Aggregated data could potentially obscure valuable insights. If there is no application of what you learn, analytics are just an exercise.
Web Analytics Best Practices
- Set Realistic Goals: Make sure your goals are appropriate with your business strategy.
- Regular Data Review: Commit yourself to analysing your data on weekly or monthly basis.
- Keep Learning: Stay updated with new tools and techniques.
- Collaborate – Connect with team members to ensure that the best decisions are made.
- Stick to User Journey: Want to know how users are going to your site, optimize their experience.
Wrapping Up
Web analytics allows you to understand who your audience is and how you can perform better with digital marketing. Establish clear targets, monitor important indicators, and use data-driven insights to help you make better choices and reach your business goals.
Coming up: Paid Advertising — understand how to create and manage high-performing paid campaigns. See you in the next module! 🚀


